content
Portfolio Overview
Since the National Pension Fund (NPF) was established under the National Pension Act in 1988, the NPF has grown exponentially to reach KRW 1070 trillion at the end of February, 2024. The National Pension Service (NPS) focuses on delivering stable returns and better managing risks by scaling down the allocation to domestic fixed income and ramping up investments in overseas and alternative assets as part of its portfolio diversification strategy.
Fund Portfolio
(in trillion won, as of end-Feb. 2024)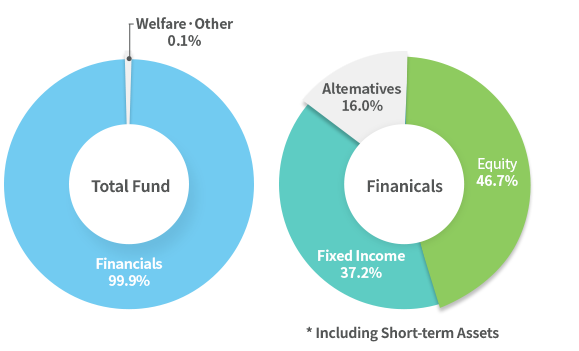
- Total Fund
- Financials 99.9%
- Welfare·Other 0.1%
- Financials
- Equity 46.7%
- Fixed Income* 37.2%
- Altematives 16.0%
* Including Short-term Assets
| Amount | Weight | |
|---|---|---|
| Total | 1069.7 | 100% |
| Welfare Sector | 0.2 | 0.0% |
| Financials* | 1068.5 | 99.9% |
| Domestic Equity | 148.0 | 13.8% |
| Global Equity | 351.5 | 32.9% |
| Domestic Fixed Income | 320.1 | 29.9% |
| Global Fixed Income | 76.4 | 7.1% |
| Alternatives | 171.4 | 16.0% |
| Short-term Assets | 1.4 | 0.1% |
| Others | 0.9 | 0.1% |
* The figures include tactical foreign exchange exposure, etc.
Note:
- To help better understand the composition of its portfolio, the NPS publishes the latest asset mix at the end of each month.
- The figures above are preliminary estimates.
Portfolio Changes in Value
(in billion won, as of end-Feb. 2024)| Current (preliminary) |
2024 (preliminary) |
2023 (preliminary) |
2022 | 2021 | 2020 | 2019 | |
|---|---|---|---|---|---|---|---|
| Total (market value) |
1,069,652 | 1,069,652 | 1,035,795 | 890,466 | 948,719 | 833,728 | 736,654 |
| Public Sector | - | - | - | - | - | - | - |
| Welfare Sector | 209 | 209 | 202 | 204 | 201 | 180 | 166 |
| Financials | 1,068,547 | 1,068,547 | 1,035,198 | 889,835 | 948,106 | 833,138 | 736,079 |
| Domestic Equity | 147,986 | 147,986 | 148,042 | 125,373 | 165,808 | 176,696 | 132,261 |
| Global Equity | 351,452 | 351,452 | 320,361 | 240,894 | 256,625 | 192,752 | 166,528 |
| Domestic Fixed Income | 320,116 | 320,116 | 326,023 | 311,186 | 339,991 | 326,099 | 320,751 |
| Global Fixed Income | 76,373 | 76,373 | 73,673 | 63,288 | 63,896 | 44,883 | 30,462 |
| Alternatives | 171,414 | 171,414 | 164,204 | 146,232 | 119,305 | 90,660 | 84,295 |
| Short-term Assets | 1,417 | 1,417 | 2,480 | 2,017 | 2,481 | 2,049 | 1,782 |
| Others | 897 | 897 | 395 | 427 | 413 | 409 | 408 |
Note:
- Until a fund management assessment is completed, preliminary estimates are provided.
- The figures above might not add up due to rounding.
- The figures in Financial Assets include tactical foregin exchange exposure, etc.